Mapping & Geocoding#
In this lesson, we’re going to learn how to analyze and visualize geographic data.
Geocoding with GeoPy#
First, we’re going to geocode data — aka get coordinates from addresses or place names — with the Python package GeoPy. GeoPy makes it easier to use a range of third-party geocoding API services, such as Google, Bing, ArcGIS, and OpenStreetMap.
Though most of these services require an API key, Nominatim, which uses OpenStreetMap data, does not, which is why we’re going to use it here.
Install GeoPy#
!pip install geopy
Import Nominatim#
From GeoPy’s list of possible geocoding services, we’re going to import Nominatim:
from geopy.geocoders import Nominatim
Nominatim & OpenStreetMap#
Nominatim (which means “name” in Latin) uses OpenStreetMap data to match addresses with geopgraphic coordinates. Though we don’t need an API key to use Nominatim, we do need to create a unique application name.
Here we’re initializing Nominatim as a variable called geolocator. Change the application name below to your own application name:
geolocator = Nominatim(user_agent="YOUR NAME's mapping app", timeout=2)
To geocode an address or location, we simply use the .geocode() function:
location = geolocator.geocode("South Cayuga Street")
location
Location(South Cayuga Street, South Hill, Ithaca, Ithaca Town, Tompkins County, New York, 14850, United States of America, (42.4359281, -76.4988639, 0.0))
Google Geocoding API#
The Google Geocoding API is superior to Nominatim, but it requires an API key and more set up. To enable the Google Geocoding API and get an API key, see Get Started with Google Maps Platform and Get Started with Geocoding API.
Show code cell source
#from geopy.geocoders import GoogleV3
#google_geolocator = GoogleV3(api_key="YOUR-API-KEY HERE")
#google_geolocator.geocode("Cayuga Street")
Get Address#
print(location.address)
South Cayuga Street, South Hill, Ithaca, Ithaca Town, Tompkins County, New York, 14850, United States of America
Get Latitude and Longitude#
print(location.latitude, location.longitude)
42.4359281 -76.4988639
Get “Importance” Score#
print(f"Importance: {location.raw['importance']}")
Importance: 0.4
Get Class and Type#
print(f"Class: {location.raw['class']} \nType: {location.raw['type']}")
Class: highway
Type: residential
Get Multiple Possible Matches#
possible_locations = geolocator.geocode("College Ave", exactly_one=False)

for location in possible_locations:
    print(location.address)
    print(location.latitude, location.longitude)
    print(f"Importance: {location.raw['importance']}")
College Avenue, Pemberton Tract, Midland, Midland County, Texas, United States of America
31.99450735 -102.08441405117188
Importance: 0.35000000000000003
College Avenue, Illinois Prairie Path, Wheaton, DuPage County, Illinois, 60187, United States of America
41.8683333 -88.0902778
Importance: 0.34778803910650136
College Avenue, Grantham, Cumberland, Pennsylvania, 17027, United States of America
40.155326 -76.994622
Importance: 0.3
College Avenue, London, Southwestern Ontario, Ontario, N6A 3H1, Canada
42.9982465 -81.2561233
Importance: 0.3
College Avenue, Spring Valley Estates, Athens-Clarke County Unified Government, Athens-Clarke County, Georgia, 30334-1458, United States of America
33.9578193 -83.3752778
Importance: 0.3
College Avenue, Windsor, Southwestern Ontario, Ontario, N9C 2K7, Canada
42.298467 -83.0652786
Importance: 0.3
College Avenue, Uptown, Racine, Wisconsin, 53403, United States of America
42.7160925 -87.784789
Importance: 0.3
College Avenue, Morris, Stevens County, Minnesota, 56267, United States of America
45.5906183 -95.9045979
Importance: 0.3
College Avenue, Swarthmore, Delaware County, Pennsylvania, 19081, United States of America
39.9058529 -75.3474084
Importance: 0.3
College Avenue, South Woodstock, Woodstock, Oxford County, Southwestern Ontario, Ontario, N4S 2E3, Canada
43.1246427 -80.745315
Importance: 0.3
location = geolocator.geocode("College Ave, Ithaca NY")

print(location.address)
print(location.latitude, location.longitude)
print(f"Importance: {location.raw['importance']}")
College Avenue, East Ithaca, Ithaca, Ithaca Town, Tompkins County, New York, 14853, United States of America
42.4431445 -76.4852319
Importance: 0.41000000000000003
Geocode with Pandas#
To geocode every location in a CSV file, we can use Pandas, make a Python function, and .apply() it to every row in the CSV file.
import pandas as pd
pd.set_option("max_rows", 400)
pd.set_option("max_colwidth", 400)
Pandas
Do you need a refresher or introduction to the Python data analysis library Pandas? Be sure to check out Pandas Basics (1-3) in this textbook!
Here we make a function with geolocator.geocode() and ask it to return the address, lat/lon, and importance score:
def find_location(row):

    place = row['place']

    location = geolocator.geocode(place)

    if location != None:
        return location.address, location.latitude, location.longitude, location.raw['importance']
    else:
        return "Not Found", "Not Found", "Not Found", "Not Found"
To start exploring, let’s read in a CSV file with a list of places in and around Ithaca.
ithaca_df = pd.read_csv("../data/ithaca-places.csv")
ithaca_df
| place | |
|---|---|
| 0 | College Town Bagels |
| 1 | Ithaca Falls |
| 2 | Moosewood Restaurant |
| 3 | Cascadilla Gorge Trail |
| 4 | Phillips Hall |
| 5 | Carriage House Cafe |
| 6 | Olin Library |
| 7 | Purity Ice Cream |
| 8 | Buttermilk Falls State Park |
| 9 | Libe Slope |
| 10 | Mundy Wildflower Garden |
| 11 | Gimme! Coffee |
| 12 | Beebe Lake |
| 13 | Ithaca Tompkins Airport |
| 14 | Wharton Studio Inc. |
Now let’s .apply() our function to this Pandas dataframe and see what results Nominatim’s geocoding service spits out.
ithaca_df[['address', 'lat', 'lon', 'importance']] = ithaca_df.apply(find_location, axis="columns", result_type="expand")
ithaca_df
| place | address | lat | lon | importance | |
|---|---|---|---|---|---|
| 0 | College Town Bagels | Collegetown Bagels, College Avenue, East Ithaca, Ithaca, Ithaca Town, Tompkins County, New York, 14850, United States of America | 42.4424 | -76.4851 | 0.35 |
| 1 | Ithaca Falls | Ithaca Falls, Ithaca, Ithaca Town, Tompkins County, New York, 14850, United States of America | 42.4528 | -76.4916 | 0.48084 |
| 2 | Moosewood Restaurant | Moosewood Restaurant, North Cayuga Street, South Hill, Ithaca, Ithaca Town, Tompkins County, New York, 14850, United States of America | 42.4406 | -76.4986 | 0.475949 |
| 3 | Cascadilla Gorge Trail | Cascadilla Gorge Trail, East Ithaca, Ithaca, Ithaca Town, Tompkins County, New York, 14853, United States of America | 42.4429 | -76.4821 | 0.375 |
| 4 | Phillips Hall | Phillips Hall, Oak Street, Oxford, Oxford Township, Butler County, Ohio, 45056, United States of America | 39.5052 | -84.7368 | 0.201 |
| 5 | Carriage House Cafe | Carriage House Cafe, B4380, Atcham, Shropshire, West Midlands, England, SY5 6QQ, United Kingdom | 52.6857 | -2.66969 | 0.301 |
| 6 | Olin Library | Olin Library, Holt Avenue, Winter Park, Orange County, Florida, 32789, United States of America | 28.591 | -81.3492 | 0.201 |
| 7 | Purity Ice Cream | Purity Ice Cream, Cascadilla Street, South Hill, Ithaca, Ithaca Town, Tompkins County, New York, 14851, United States of America | 42.4445 | -76.5089 | 0.301 |
| 8 | Buttermilk Falls State Park | Buttermilk Falls State Park, South Hill, Ithaca Town, Tompkins County, New York, United States of America | 42.4162 | -76.5164 | 0.771981 |
| 9 | Libe Slope | Libe Slope, East Ithaca, Ithaca, Ithaca Town, Tompkins County, New York, United States of America | 42.4484 | -76.4866 | 0.4 |
| 10 | Mundy Wildflower Garden | Mundy Wildflower Garden, Forest Home, Ithaca Town, Tompkins County, New York, United States of America | 42.4505 | -76.4692 | 0.45 |
| 11 | Gimme! Coffee | Gimme! Coffee, West State Street, South Hill, Ithaca, Ithaca Town, Tompkins County, New York, 14851, United States of America | 42.4395 | -76.5064 | 0.201 |
| 12 | Beebe Lake | Beebe Lake, Forest Home Drive, Forest Home, Ithaca Town, Tompkins County, New York, 14853, United States of America | 42.4512 | -76.4757 | 0.201 |
| 13 | Ithaca Tompkins Airport | Ithaca Tompkins Regional Airport, Brown Road, Lansing, Lansing Town, Tompkins County, New York, 14850, United States of America | 42.491 | -76.4587 | 0.624671 |
| 14 | Wharton Studio Inc. | Not Found | Not Found | Not Found | Not Found |
What do you notice about these results? ☝️☝️☝️
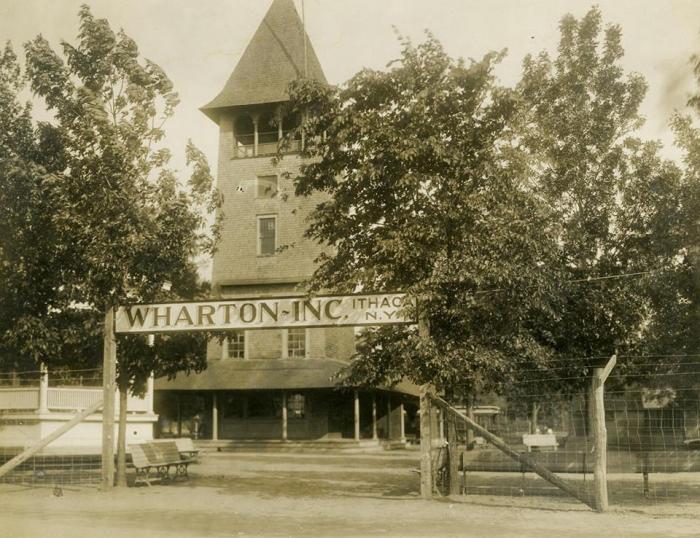
Wharton Studio Inc. (1914-1919) — early 20th-century Ithaca movie studio, located in what is now Stewart Park
To check out more historical photos of Wharton Studio Inc., see the Cornell library.
Making Interactive Maps#
To map our geocoded coordinates, we’re going to use the Python library Folium. Folium is built on top of the popular JavaScript library Leaflet.
To install and import Folium, run the cells below:
!pip install folium
import folium
Base Map#
First, we need to establish a base map. This is where we’ll map our geocoded Ithaca locations. To do so, we’re going to call folium.Map()and enter the general latitude/longitude coordinates of the Ithaca area at a particular zoom.
(To find latitude/longitude coordintes for a particular location, you can use Google Maps, as described here.)
ithaca_map = folium.Map(location=[42.44, -76.5], zoom_start=14)
ithaca_map
Add a Marker#
Adding a marker to a map is easy with Folium! We’ll simply call folium.Marker() at a particular lat/lon, enter some text to display when the marker is clicked on, and then add it to our base map.
folium.Marker(location=[42.444695, -76.482233], popup="Intro to Cultural Analytics").add_to(ithaca_map)
ithaca_map
Add Markers From Pandas Data#
To add markers for every location in our Pandas dataframe, we can make a Python function and .apply() it to every row in the dataframe.
def create_map_markers(row, map_name):
    folium.Marker(location=[row['lat'], row['lon']], popup=row['place']).add_to(map_name)
Before we apply this function to our dataframe, we’re going to drop any locations that were “Not Found” (which would cause folium.Marker() to return an error).
found_ithaca_locations = ithaca_df[ithaca_df['address'] != "Not Found"]
found_ithaca_locations.apply(create_map_markers, map_name=ithaca_map, axis='columns')
ithaca_map
Save Map#
ithaca_map.save("Ithaca-map.html")
Torn Apart / Separados#
The data in this section was drawn from Torn Apart / Separados Project. It maps the locations of Immigration and Customs Enforcement (ICE) detention facilities, as featured in Volume 1.
Add a Circle Marker#
There are a few different kinds of markers that we can add to a Folium map, including circles. To make a circle, we can call folium.CircleMarker() with a particular radius and the option to fill in the circle. You can explore more customization options in the Folium documentation. We’re also going to add a hover tooltip in addition to a popup.
def create_ICE_map_markers(row, map_name):

    folium.CircleMarker(location=[row['lat'], row['lon']], raidus=100, fill=True,
                popup=folium.Popup(f"{row['Name'].title()} <br> {row['City'].title()}, {row['State']}", max_width=200),
                  tooltip=f"{row['Name'].title()} <br> {row['City'].title()}, {row['State']}"
                 ).add_to(map_name)
ICE_df = pd.read_csv("../data/ICE-facilities.csv")
ICE_df
| lat | lon | adpSum | onWeb | Flags | fulladdr | DETLOC | Name | Address | City | ... | ICE.Threat.Level.2 | ICE.Threat.Level.3 | No.ICE.Threat.Level | Facility.Operator | FY17.Calendar.Days.in.Use | FY17...of.Days.in.Use | FY17.Total.Mandays | FY17.Max.Pop.Count | geocodelat | geocodelon | |
|---|---|---|---|---|---|---|---|---|---|---|---|---|---|---|---|---|---|---|---|---|---|
| 0 | 28.895000 | -99.121200 | 8391 | 28.8950 | NaN | 566 VETERANS DRIVE PEARSALL TX 78061 | STCDFTX | SOUTH TEXAS DETENTION COMPLEX | 566 VETERANS DRIVE | PEARSALL | ... | 112 | 311 | 1187 | GEO | 372 | 1.02 | 598554 | 1854 | 28.896498 | -99.116863 |
| 1 | 32.036600 | -84.771800 | 8004 | 32.0366 | NaN | 146 CCA ROAD LUMPKIN GA 31815 | STWRTGA | STEWART DETENTION CENTER | 146 CCA ROAD | LUMPKIN | ... | 344 | 365 | 671 | CCA | 372 | 1.02 | 671515 | 1992 | 32.037982 | -84.772465 |
| 2 | 34.559200 | -117.441000 | 7265 | 34.5592 | NaN | 10250 RANCHO ROAD ADELANTO CA 92301 | ADLNTCA | ADELANTO ICE PROCESSING CENTER | 10250 RANCHO ROAD | ADELANTO | ... | 206 | 164 | 726 | GEO | 372 | 1.02 | 625414 | 1918 | 34.557721 | -117.442524 |
| 3 | 32.817700 | -111.520000 | 7096 | 32.8177 | NaN | 1705 EAST HANNA RD. ELOY AZ 85131 | EAZ | ELOY FEDERAL CONTRACT FACILITY | 1705 EAST HANNA RD. | ELOY | ... | 154 | 232 | 785 | CCA | 372 | 1.02 | 502952 | 1489 | 32.821231 | -111.549772 |
| 4 | 47.249100 | -122.421000 | 6757 | 47.2491 | NaN | 1623 E. J STREET TACOMA WA 98421 | CSCNWWA | NORTHWEST DETENTION CENTER | 1623 E. J STREET | TACOMA | ... | 166 | 174 | 693 | GEO | 372 | 1.02 | 519386 | 1563 | 47.250214 | -122.422746 |
| ... | ... | ... | ... | ... | ... | ... | ... | ... | ... | ... | ... | ... | ... | ... | ... | ... | ... | ... | ... | ... | ... |
| 481 | 39.671492 | -75.714329 | 1 | 0.0000 | NaN | 970 BROAD STREET NEWARK NJ 7102 | NEWHOLD | NEW/INS OS HOLD ROOM | 970 BROAD STREET | NEWARK | ... | 0 | 0 | 1 | FEDERAL | 37 | 0.10 | 50 | 2 | 39.671492 | -75.714329 |
| 482 | 26.204563 | -98.270145 | 1 | 0.0000 | NaN | BENTSEN TOWER, 1701 W BUS HWY 83 MCALLEN TX 78501 | USMS3TX | US MARSHALS (SOUTH DISTRICT, TEXAS) | BENTSEN TOWER, 1701 W BUS HWY 83 | MCALLEN | ... | 0 | 0 | 0 | FEDERAL | 0 | 0.00 | 0 | 0 | 26.204563 | -98.270145 |
| 483 | 41.528728 | -73.363545 | 1 | 0.0000 | NaN | BRIDGEWATER STATE HOSPITAL BRIDGEWATER MA 2324 | MABSHOS | BRIDGEWATER STATE HOSPITAL | BRIDGEWATER STATE HOSPITAL | BRIDGEWATER | ... | 0 | 0 | 0 | HOSPITAL | 0 | 0.00 | 0 | 0 | 41.528728 | -73.363545 |
| 484 | NaN | NaN | 1 | 0.0000 | NaN | Redacted Redacted Redacted Redacted | Redacted | Redacted | Redacted | Redacted | ... | 0 | 0 | 0 | ORR | 17 | 0.05 | 17 | 1 | NaN | NaN |
| 485 | NaN | NaN | 1 | 0.0000 | NaN | Redacted Redacted Redacted Redacted | Redacted | Redacted | Redacted | Redacted | ... | 0 | 0 | 0 | NaN | 0 | 0.00 | 0 | 0 | NaN | NaN |
486 rows × 51 columns
US_map = folium.Map(location=[42, -102], zoom_start=4)
US_map
ICE_df = ICE_df.dropna(subset=['lat', 'lon'])
ICE_df.apply(create_ICE_map_markers, map_name=US_map, axis="columns")
US_map
Choropleth Maps#
Choropleth map = a map where areas are shaded according to a value
The data in this section was drawn from Torn Apart / Separados Project. This data maps the “cumulative ICE awards since 2014 to contractors by congressional district,” as featured in Volume 2.
To create a chropleth map with Folium, we need to pair a “geo.json” file (which indicates which parts of the map to shade) with a CSV file (which includes the variable that we want to shade by).
The following data was drawn from the Torn Apart / Separados project
US_districts_geo_json = "../data/ICE_money_districts.geo.json"
US_districts_csv = pd.read_csv("../data/ICE_money_districts.csv")
US_districts_csv = US_districts_csv .dropna(subset=['districtName', 'representative'])
US_districts_csv
| id | id2 | state | districtNumber | districtName | party | district_url | representative | representative_photo_url | total_awards | |
|---|---|---|---|---|---|---|---|---|---|---|
| 0 | 5001500US0101 | 101 | Alabama | 1 | ta-ordinal-st-m | republican | https://en.wikipedia.org/wiki/Alabama%27s_1st_congressional_district | Bradley Byrne | https://upload.wikimedia.org/wikipedia/commons/7/71/Rep_Bradley_Byrne_%28cropped%29.jpg | 0.00 |
| 1 | 5001500US0102 | 102 | Alabama | 2 | ta-ordinal-nd-m | republican | https://en.wikipedia.org/wiki/Alabama%27s_2nd_congressional_district | Martha Roby | https://upload.wikimedia.org/wikipedia/commons/5/55/Martha_roby_113_congressional_portrait_%28cropped%29.jpg | 38577.40 |
| 2 | 5001500US0103 | 103 | Alabama | 3 | ta-ordinal-rd-m | republican | https://en.wikipedia.org/wiki/Alabama%27s_3rd_congressional_district | Mike Rogers | https://upload.wikimedia.org/wikipedia/commons/e/ee/Mike_Rogers_official_photo_%28cropped%29.jpg | 0.00 |
| 3 | 5001500US0104 | 104 | Alabama | 4 | ta-ordinal-th-m | republican | https://en.wikipedia.org/wiki/Alabama%27s_4th_congressional_district | Robert Aderholt | https://upload.wikimedia.org/wikipedia/commons/9/9f/Rep._Robert_B._Aderholt_%28cropped%29.jpg | 171873.55 |
| 4 | 5001500US0105 | 105 | Alabama | 5 | ta-ordinal-th-m | republican | https://en.wikipedia.org/wiki/Alabama%27s_5th_congressional_district | Mo Brooks | https://upload.wikimedia.org/wikipedia/commons/b/b6/Mo_Brooks_Portrait_%28cropped%29.jpg | 40346.00 |
| ... | ... | ... | ... | ... | ... | ... | ... | ... | ... | ... |
| 432 | 5001500US5506 | 5506 | Wisconsin | 6 | ta-ordinal-th-m | republican | https://en.wikipedia.org/wiki/Wisconsin%27s_6th_congressional_district | Glenn Grothman | https://upload.wikimedia.org/wikipedia/commons/1/16/Glenn_Grothman_official_congressional_photo_%28cropped%29.jpg | 3242401.61 |
| 433 | 5001500US5507 | 5507 | Wisconsin | 7 | ta-ordinal-th-m | republican | https://en.wikipedia.org/wiki/Wisconsin%27s_7th_congressional_district | Sean Duffy | https://upload.wikimedia.org/wikipedia/commons/d/d7/Sean_Duffy_official_congressional_photo_%28cropped%29.jpg | 32698.55 |
| 434 | 5001500US5508 | 5508 | Wisconsin | 8 | ta-ordinal-th-m | republican | https://en.wikipedia.org/wiki/Wisconsin%27s_8th_congressional_district | Mike Gallagher | https://upload.wikimedia.org/wikipedia/commons/a/ad/Mike_Gallagher_Official_Portrait_2017_%28cropped%29.png | 237392.73 |
| 435 | 5001500US5600 | 5600 | Wyoming | 0 | ta-at-large-district | republican | https://en.wikipedia.org/wiki/Wyoming%27s_at-large_congressional_district | Liz Cheney | https://upload.wikimedia.org/wikipedia/commons/d/dd/Liz_Cheney_official_portrait.jpg | 0.00 |
| 436 | 5001500US7298 | 7298 | Puerto Rico | 98 | ta-ordinal-th-m | no-rep | https://en.wikipedia.org/wiki/Puerto_Rico%27s_at-large_congressional_district | Resident Commissioner Jenniffer González | https://upload.wikimedia.org/wikipedia/commons/thumb/7/7a/Official_portrait_of_Resident_Commissioner_Jenniffer_Gonzalez.jpg/800px-Official_portrait_of_Resident_Commissioner_Jenniffer_Gonzalez.jpg | 323102.10 |
431 rows × 10 columns
US_map = folium.Map(location=[42, -102], zoom_start=4)

folium.Choropleth(
    geo_data = US_districts_geo_json,
    name = 'choropleth',
    data = US_districts_csv,
    columns = ['districtName', 'total_awards'],
    key_on = 'feature.properties.districtName',
    fill_color = 'GnBu',
    line_opacity = 0.2,
    legend_name= 'Total ICE Money Received'
).add_to(US_map)

US_map
Add a Tooltip to Choropleth#
tooltip = folium.features.GeoJson(
    US_districts_geo_json,
    tooltip=folium.features.GeoJsonTooltip(fields=['representative', 'state', 'party', 'total_value'], localize=True)
                                )
US_map.add_child(tooltip)
US_map